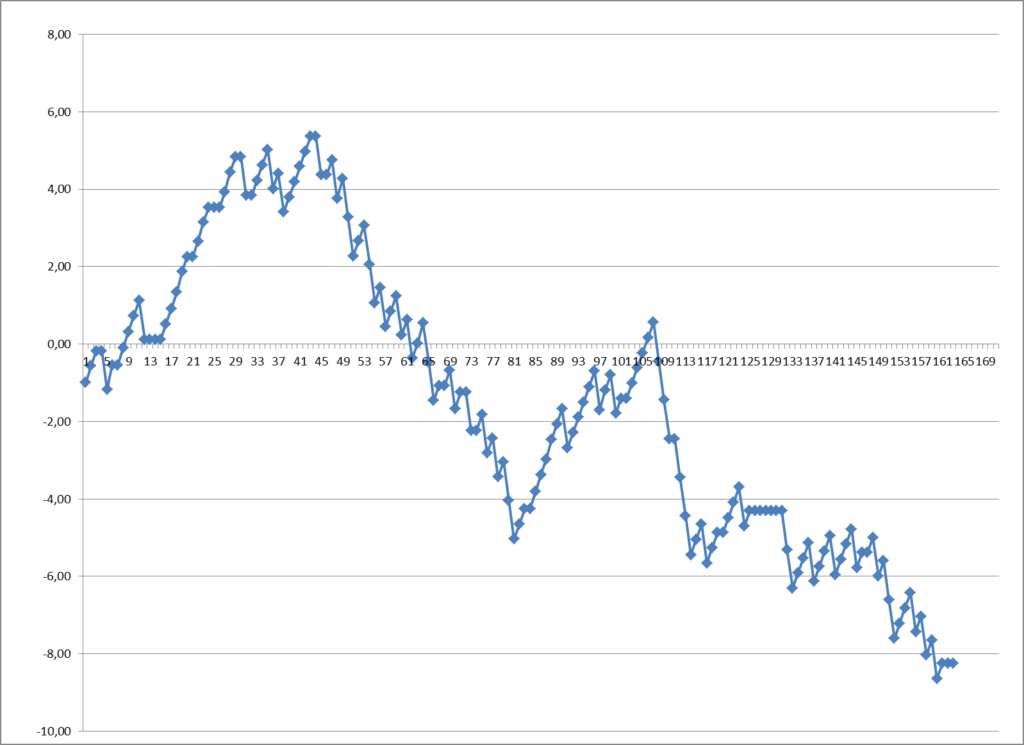
Change is often seen as a way to improve things, but sometimes it can have the opposite effect. However, it’s essential not to be quick to judge as it takes a lot of data to determine if something is good or bad. The most important thing is to measure everything to have an overall view of the situation.
Recently, I noticed that the curve on my betting chart was going in the wrong direction. So, I decided to measure everything and have an overall view of the situation. I found that there were some negative aspects that were affecting the positive ones. This is why it’s important to look at all aspects of a situation, not just one or two.

Looking at my recent results, I saw that there was a loss of -8.25 points since the beginning of the year. While not a tragedy, the trend seemed to be in the direction of loss. I discovered that the effectiveness of my betting strategy decreased when playing matches where the favorite had odds below 2. The percentage decreased from 73.4% last year to 71.7% this year. Additionally, when playing with odds of 1.4, there were still a lot of matches that had GoalBeforeOdds (15%), making it seem like it wouldn’t be profitable in the long run.

A potential solution could be to return to the previous criteria, where there were more events. However, for the current selection, the goal statistics in the second half have improved (85% to 81.9% last year). Implied Odds for 85% is 1.18, so the FHG filters can be used to bet over 0.5 goals in the second half at 1.25 (80% implied odds). It may be hard to get this rate in some matches, but time will tell.
In conclusion, it’s essential to not be too quick to judge changes and to measure everything to have an overall view of the situation. Till the end of the year, I will be recording those new bets related to SHG.
Appendix: recorded data FHG (the latest bets)


