As I have mentioned many times in trading / betting the most important thing is to focus not on winnings but on losers. in fact, calculating the risk of bankruptcy and testing the strategy is the most important task in order to have the data for analysis.
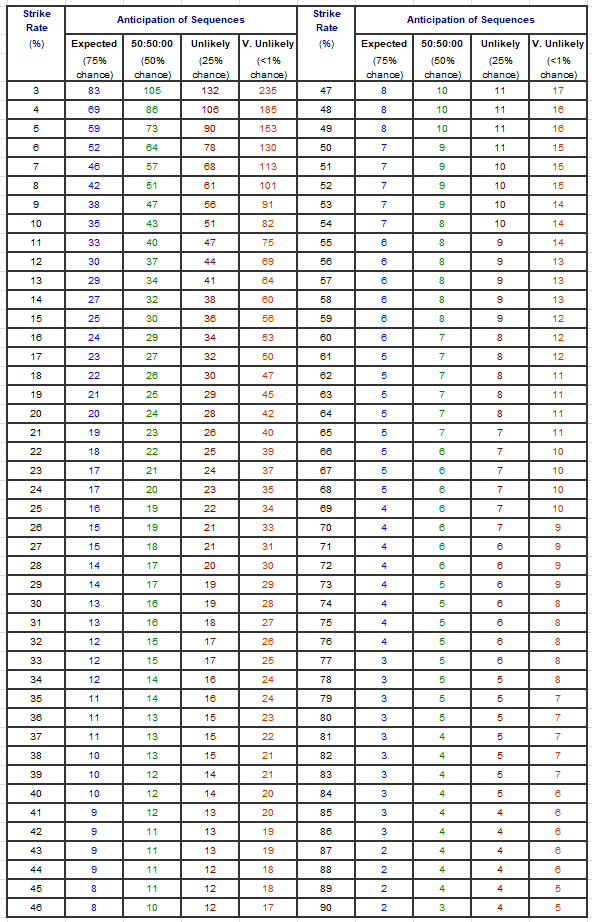
Recently I stumbled upon a great article about losing runs. Author Steve Jones from CD Systems educates you on strike rates and how they can guide you as per losing runs and what to expect. The full story is available here: Don`t Go Broke
In a nutshell, Steve calculates your losing run based on your strike rate. Look at the table from his 650 bets:
I`ve decided to check the stats with bigger data and some simple football strategies. I have backtested data for over0,5 goals market before kick-off. There is over 92% chance that the game will end with at least 1 goal for 30283 samples. Have a look a the results:
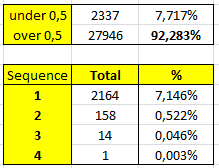
From the tested data we have encountered only 1 sequence of losing bets 4 times in a row. If we compare it to Steve`s table we have got similar results. His table ends with a 90% strike rate and a possible sequence of 5 losing runs.
I`ve added additional tests, for the same sample of data, but filtered the matches when the 0-0 draw was still in 30mins (14393 games). Below are the results:
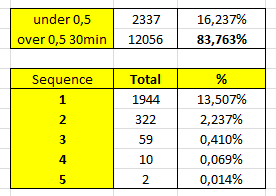
With an 83% strike rate, we should get at worst 7 losing bets in a row, as the above table shows we got lucky and have only 5.
Steve`s samples and my additional examples show you that there is a correlation between strike rate and losing run. I hope that the table above makes you more confident about probability and helps you to calculate your bank size and give you some idea about protecting your bankroll.
Betting / Trading is math!